

Computer Vision Services: Use Cases from Manufacturing to Healthcare
Computer vision—the ability of machines to see and interpret images and videos—is one of AI's most mature and commercially valuable applications. It's not sci-fi anymore. It's powering quality control in factories, detecting tumors in hospitals, enabling checkout-free retail, and sorting packages in logistics hubs, at scale, today.
If you run a business where visual quality, accuracy, or speed matters, computer vision services can multiply your operational capacity and catch things human eyes miss. A manufacturing plant can inspect 1,000 items per hour instead of 100. A radiologist can triage imaging cases in priority order rather than sequential order. A logistics hub can route millions of packages with near-zero misrouting.
This guide covers what computer vision solutions actually are, the technology powering them, real-world use cases across industries, and how to evaluate if computer vision is right for your organization.
What Is Computer Vision? The Technical Foundations
Computer vision is the field of AI that teaches machines to understand images and video. It bridges low-level pixel data and high-level semantic understanding.
Simple example: A manufacturing camera captures an image of a machined part. The computer vision system analyzes pixels and outputs: "Part is 45.2mm diameter (within spec) with no visible cracks or burrs (pass)." A human inspector would take 30 seconds; the vision system takes 50 milliseconds.
Complex example: A hospital receives a chest X-ray. The computer vision system analyzes the image and outputs: "Posterior opacity in lower-left lobe consistent with pneumonia (high confidence 94%). Recommend urgent review by radiologist." The radiologist now prioritizes this case instead of reading sequentially.
The computer vision pipeline:
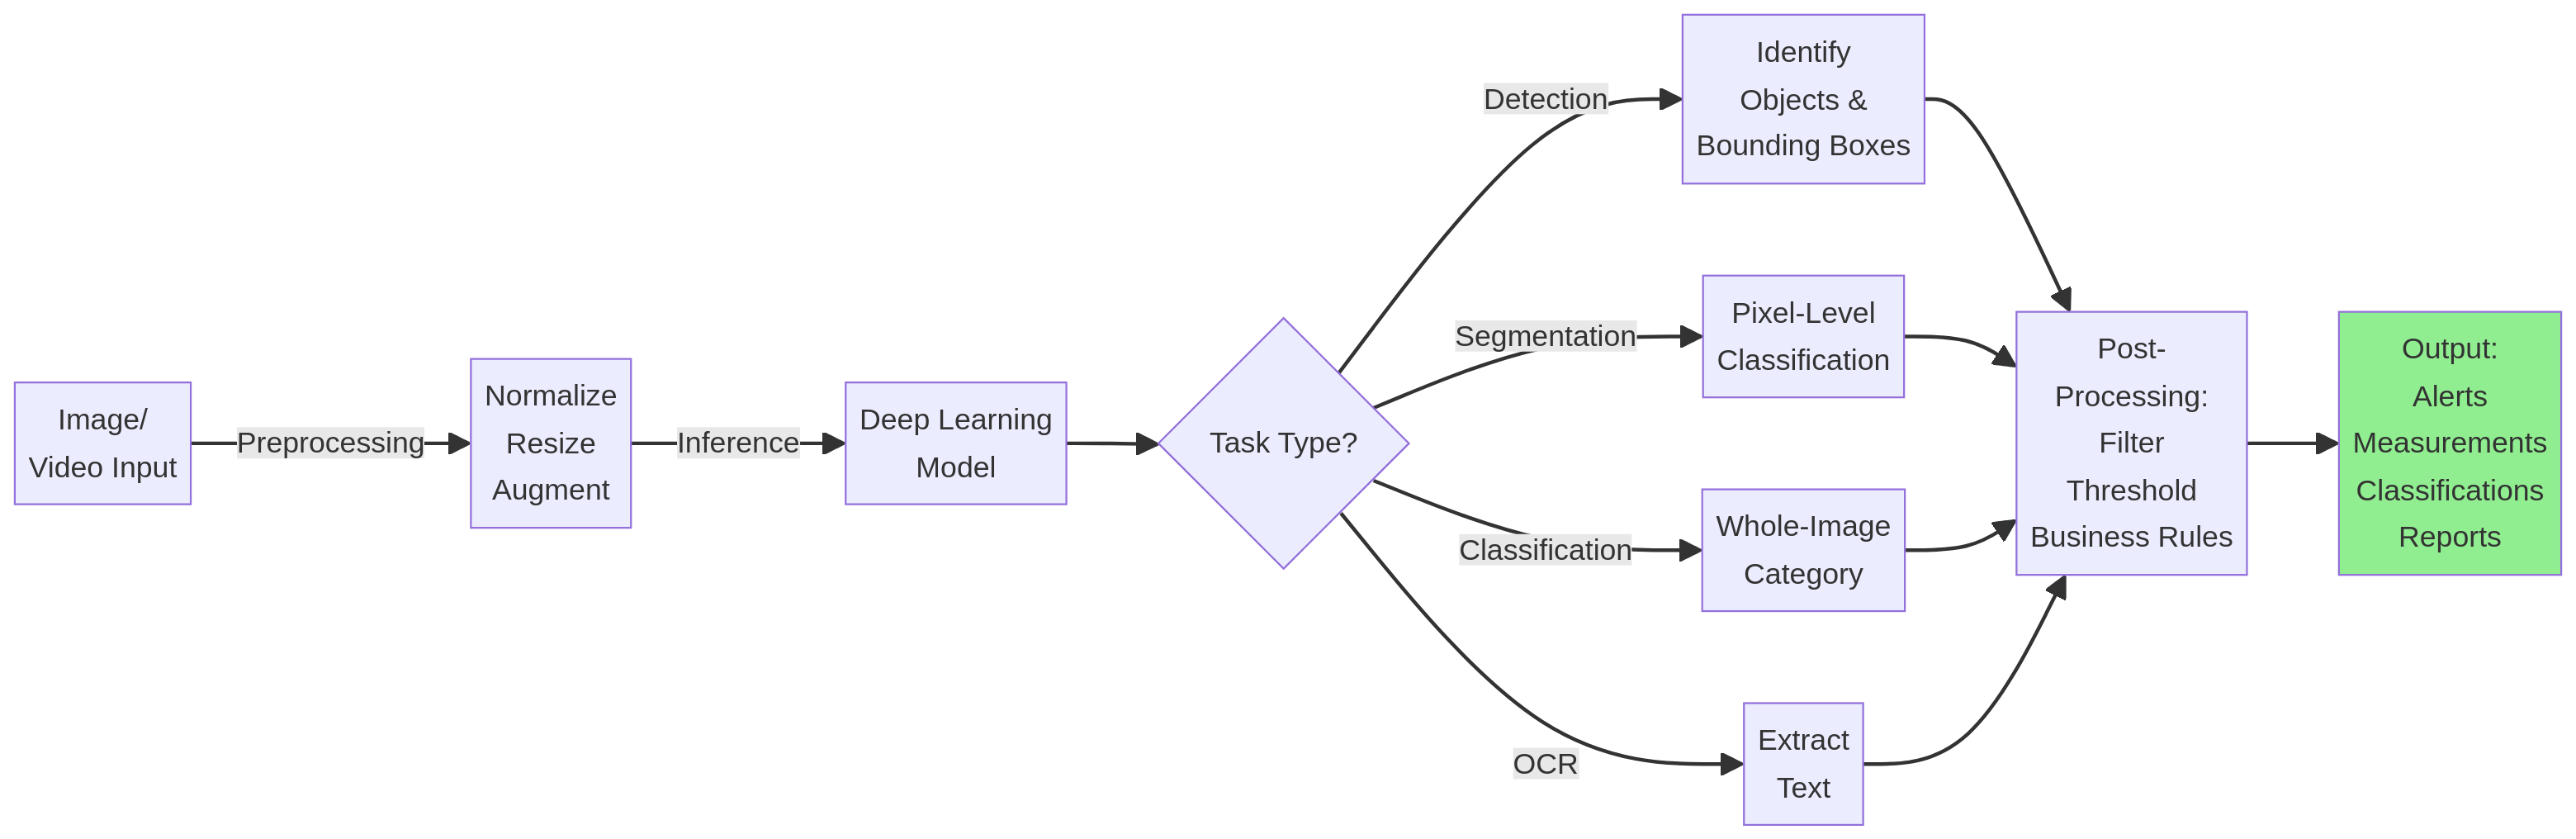
Core Computer Vision Tasks
1. Object Detection
What it does: Identifies objects in images and draws bounding boxes around them, with confidence scores.
Output: For each object: (class, bounding box coordinates, confidence score)
Example: A quality control camera scans a circuit board. The model detects all components and outputs: Component_A at (23,45,89,110) confidence 0.98, Component_B at (110,35,178,102) confidence 0.95, Solder_Joint at (50,99,62,110) confidence 0.88.
Algorithms: YOLO (You Only Look Once), Faster R-CNN, SSD (Single Shot Detector)
Typical accuracy: 90–98% depending on object complexity and image quality
2. Semantic Segmentation
What it does: Classifies every pixel in an image as belonging to a category.
Output: For each pixel: class label (foreground, background, defect, good material, etc.)
Example: A manufacturing plant inspects cloth for defects. Segmentation identifies pixels that are part of the defect (contrast, weave pattern changes, contamination). Output is a pixel-level map showing defect location and size.
Algorithms: U-Net, DeepLab, FCN (Fully Convolutional Networks)
Typical accuracy: 85–95% (per-pixel classification is harder than object detection)
3. Image Classification
What it does: Assigns an entire image to a category.
Output: Class label and confidence score
Example: A retailer's self-checkout system needs to identify fruits. Customer places item on scale, camera captures image, model outputs: "Banana, confidence 0.97"
Algorithms: ResNet, VGG, MobileNet, Vision Transformers
Typical accuracy: 95–99% (especially for well-defined categories)
4. Optical Character Recognition (OCR)
What it does: Extracts text from images—handwritten or printed.
Output: Recognized text with confidence scores for each character
Example: A document processing system scans invoices. OCR extracts invoice number, vendor, date, items, amounts. Output is structured data ready for database entry.
Algorithms: Tesseract (open-source), commercial APIs (Google Cloud Vision, AWS Textract), deep learning models (CRNN, Transformer-based)
Typical accuracy: 95–99% for printed text; 70–90% for handwritten
5. Instance Segmentation
What it does: Combines detection (finding objects) and segmentation (pixel-level classification) to identify individual instances of objects and segment each one separately.
Output: For each object instance: class, mask (pixel-level boundary), confidence score
Example: A surgical imaging system needs to identify and isolate surgical instruments in a video. Instance segmentation finds Instrument_A with pixels (12,34,56,78,...) and Instrument_B with pixels (89,01,23,45,...).
Algorithms: Mask R-CNN, YOLACT, Panoptic Segmentation networks
Typical accuracy: 85–95%
6. Pose Estimation
What it does: Identifies body parts or key points in images (joints, landmarks).
Output: Key point locations (x, y coordinates) for each detected part
Example: A logistics company wants to monitor worker safety. Pose estimation identifies worker joint positions and alerts if worker is falling or in unsafe position (e.g., twisted torso, overextended reach).
Algorithms: OpenPose, MediaPipe, Keypoint R-CNN
Typical accuracy: 90–97% depending on body pose complexity
Real-World Use Cases by Industry
Manufacturing & Quality Control
Challenge: Inspect manufactured parts for defects, dimensions, finish quality at production speed.
Computer Vision Solution:
- Defect detection: Cameras scan parts moving on conveyor belt. CV model identifies cracks, dents, misalignment, contamination, finish defects.
- Dimensional verification: Measure part dimensions to sub-millimeter precision (vs. manual gauging every 100th part).
- Surface inspection: High-resolution imaging detects micro-scratches, discoloration, coating inconsistencies.
- Assembly verification: Confirm all components are present, correctly positioned, properly fastened.
Value:
- Catch defects before they reach customers (prevent recalls)
- Reduce manual inspection labor (1 vision system replaces 5–10 inspectors)
- 100% inspection vs. sampling (every part is checked)
- Data-driven quality (track defect trends over time)
Implementation example: Automotive supplier manufacturing engine components. Vision system inspects 1,000+ parts/day. Detects surface defects down to 0.1mm. Cost: €150k system, €40k/year maintenance. Saves €300k/year in reduced scrap and labor. ROI: 6 months.
Technology stack:
- Industrial cameras (line scan or area cameras, high resolution, controlled lighting)
- Lighting (backlighting, ring lights, structured light for 3D)
- Software (object detection, segmentation, measurement algorithms)
- Integration (conveyor speed coordination, pass/fail gates, data logging)
Healthcare & Medical Imaging
Challenge: Radiologists review hundreds of medical images per day. Errors occur. Diagnosis can be delayed.
Computer Vision Solution:
- Diagnostic assistance: AI pre-analyzes CT, MRI, X-ray images, highlights abnormalities, prioritizes urgent cases.
- Tumor detection: Identifies suspicious lesions in breast, lung, liver, prostate imaging with confidence scores.
- Measurement: Automatically measures lesion size, calculates volumes, tracks changes over time.
- Triage: Routes images to appropriate specialists based on suspected pathology.
Value:
- Radiologists focus on confirmed abnormalities (efficiency)
- Early detection improves outcomes (urgency triage)
- Consistency (algorithm applies same criteria to every image)
- Reduced missed diagnoses (second-reader effect)
Implementation example: Radiology department at a 300-bed hospital. AI system pre-analyzes 50–100 chest X-rays/day. Flags high-risk cases (pneumonia, pneumothorax, masses) for priority reading. Reduces average time from imaging to diagnosis from 4 hours to 45 minutes for urgent cases. Improves diagnostic sensitivity from 94% to 97%.
Regulations: High-risk AI system under EU AI Act compliance. Requires clinical validation, human oversight, adverse event reporting.
Technology stack:
- DICOM image handling (medical imaging standard)
- Deep learning models (CNN-based, trained on radiologist annotations)
- Integration with hospital systems (PACS, EHR)
- Explainability tools (highlight abnormal regions for radiologist review)
Retail & E-Commerce
Inventory Management:
- Shelf monitoring: Smart cameras in stores detect out-of-stock conditions, misplaced items, price tag errors.
- Planogram compliance: Verify shelf layouts match corporate standards (correct products in correct locations).
- Theft detection: Identify suspicious behavior (pocket items, concealment).
Checkout-Free Shopping:
- Item detection: Computer vision identifies products as customers place them in bags (computer vision + weight sensing).
- Real-time pricing: Pull prices from central system as items are scanned.
- Fraud prevention: Detect attempts to swap barcodes or conceal items.
Value:
- Reduce labor (fewer price checks, inventory counts)
- Improve inventory accuracy (catch stockouts before customers notice)
- Increase sales (out-of-stock items are missed revenue)
- Enhance customer experience (faster checkout)
Implementation example: Checkout-free grocery store (Amazon Go model). Computer vision tracks customers and items from entry to exit. Real-time invoice generated as they leave. Reduces checkout friction to near-zero. Enables smaller formats in dense urban areas.
Technology stack:
- Multi-camera setups (overhead, side angles, ceiling-mounted)
- Real-time tracking algorithms (Kalman filters, Hungarian algorithm for customer/item association)
- Integration with POS, inventory systems
- Edge computing (some processing on local hardware to reduce latency)
Logistics & Package Handling
Challenge: Millions of packages flowing through hubs daily. Manual sorting is slow and error-prone. Misroutes are expensive.
Computer Vision Solution:
- Barcode/label reading: OCR captures shipping labels at sorting speed (200–300 packages/minute).
- Package anomaly detection: Oversized/undersized packages, damaged boxes, leaking contents.
- Sortation routing: Route packages to correct destination based on label reading.
- Damage documentation: Photograph damaged packages for insurance/claims.
Value:
- Near-zero misroute rate (99.8%+ delivery accuracy)
- Process 10–100x more packages with same labor
- Reduce claims from damaged goods (documented with images)
- Optimize hub layouts based on routing data
Implementation example: International logistics hub processing 5M packages/month. Vision-based sortation system reads labels, identifies oversized items, routes to correct outbound lanes. Achieves 99.85% accuracy (15 misroutes per 10k packages). Cost: €2M system, €500k/year operations. Saves €5M/year in reduced misroutes, labor reduction, and throughput increase. ROI: 5 months.
Technology stack:
- High-speed cameras (line scan, synchronized with conveyor)
- Bright, consistent lighting (barcode readability)
- OCR engines (specialized for shipping label formats)
- Real-time decision logic (routing rules)
- Integration with WMS, conveyor controls
Agriculture & Crop Monitoring
Challenge: Large farms have limited visibility into crop health, pest pressure, nutrient status across thousands of acres.
Computer Vision Solution:
- Aerial imagery (drone): Fly drones over fields, capture multispectral images (RGB + near-infrared).
- Vegetation indices: NDVI (Normalized Difference Vegetation Index) identifies stressed plants, nutrient deficiencies, irrigation issues.
- Pest detection: Identify areas with high pest pressure (defoliation, visible damage).
- Yield prediction: Estimate yield weeks before harvest based on crop growth stage and health.
Value:
- Precision farming (apply water, fertilizer, pesticide only where needed)
- Reduce inputs (fertilizer, water usage) by 10–30%
- Improve yields (early intervention)
- Harvest planning (predict yield for logistics)
Implementation example: 2,000-acre grain farm in Germany. Drone flights every 2 weeks during growing season. CV analysis identifies 15 separate zones with different stress patterns. Differential irrigation reduces water usage by 18%. Targeted pest control reduces pesticide by 22%. Yield increases 8% through better management. Cost: €50k initial setup, €15k/year. Savings: €80k/year. ROI: 8 months.
Technology stack:
- Drones with multispectral cameras
- Satellite imagery (Sentinel-2, Planet Labs)
- Vegetation index algorithms (NDVI, GNDVI, etc.)
- ML models (crop stress prediction, yield forecasting)
- Integration with farm management systems
Construction & Structural Inspection
Challenge: Inspect buildings, bridges, infrastructure for damage, deterioration, safety issues.
Computer Vision Solution:
- Drone inspection: High-resolution images from drones eliminate need for scaffolding, high-access equipment.
- Crack detection: Identify structural cracks, categorize by size and risk level.
- Material degradation: Detect rust, corrosion, weathering, mold growth.
- 3D reconstruction: Create 3D models of structures from image sets (photogrammetry).
Value:
- Safety (inspect dangerous-to-access areas)
- Speed (inspect in hours vs. days with traditional scaffolding)
- Cost reduction (avoid expensive equipment rental)
- Documentation (detailed records for insurance, insurance claims)
Implementation example: Annual bridge inspection. Traditional method: 2 weeks, €80k (scaffolding, equipment, labor, traffic control). Drone inspection: 2 days, €15k (drone pilot, analysis). Detects crack in support beam requiring maintenance. Detailed image record speeds maintenance planning. Cost savings: €65k per inspection. Enables more frequent inspection for safety.
Technology stack:
- Drones with thermal and RGB cameras
- Photogrammetry software (structure-from-motion)
- Crack detection models
- 3D rendering and measurement tools
- Integration with asset management systems
Technology Stack: What Powers Computer Vision
The Deep Learning Model
At the core: a neural network trained to recognize patterns in images.
Common architectures:
- Convolutional Neural Networks (CNN): The foundation of most vision tasks. Learns spatial patterns through convolutional layers.
- ResNet, VGG, DenseNet: Standard CNN architectures, well-established, pre-trained on ImageNet.
- YOLO, Faster R-CNN, SSD: Object detection architectures optimized for speed and accuracy.
- U-Net, DeepLab: Segmentation networks that preserve spatial information.
- Vision Transformers (ViT): Newer approach using transformer architecture. Often outperforms CNNs on large datasets but requires more training data.
Training process:
- Start with pre-trained model (trained on ImageNet or similar large dataset)
- Fine-tune on your domain-specific data (transfer learning, usually 1,000–10,000 labeled images)
- Evaluate on held-out test set
- Deploy and monitor
Cost: Pre-trained models are free or cheap. Domain-specific fine-tuning requires labeled data (expensive) and compute (€1k–10k for a robust model).
Hardware for Inference
Where does inference run?
Cloud inference (scalable, pay-per-use):
- AWS SageMaker, Google Vertex AI, Azure ML
- Pros: Scalable, automatic scaling, easy to update models
- Cons: Latency (100–500ms for API call), cost at scale, data privacy (data leaves your facility)
Edge inference (local, fast, private):
- NVIDIA Jetson devices (manufacturing, robotics)
- Intel NUC, Apple Neural Engine (for lighter workloads)
- Custom hardware (specialized accelerators)
- Pros: Sub-50ms latency, data stays local, works offline
- Cons: Fixed capacity, requires local maintenance, more complex deployment
Best practice: Hybrid approach. Critical real-time decisions run on edge (manufacturing QC, robotics). Non-urgent decisions or high-volume batch processing runs in cloud.
Supporting Infrastructure
Data annotation & labeling:
- Tools: Labelbox, Roboflow, CVAT
- Cost: €1–5 per image (depending on complexity)
- Time: 2–3 weeks for 10,000 images
Model training & experiment tracking:
- Tools: Weights & Biases, MLflow, Kubeflow
- Essential for reproducibility and versioning
Image preprocessing & augmentation:
- Tools: OpenCV, Pillow, Albumentations
- Critical for robustness (rotate, flip, zoom, noise to expand training diversity)
Monitoring & quality assurance:
- Dashboards tracking model performance, latency, error rates
- Alert thresholds (accuracy < 95%, latency > 100ms)
- Automated retraining when performance degrades
Choosing a Computer Vision Partner
When evaluating computer vision services, assess:
1. Domain Expertise
Have they built vision systems in your industry? Manufacturing QC is different from medical imaging is different from logistics. Domain knowledge matters.
Red flag: "We've built computer vision for everything." Unlikely. Or they're not specialized enough to excel.
Green flag: "We've built 12 manufacturing QC systems, all in automotive or electronics. Here are 3 case studies."
2. Hardware Integration
Can they work with your existing infrastructure? Manufacturing plants run specific cameras and hardware. Hospitals use DICOM standards. Logistics hubs have specific camera specifications.
Ask: Can you integrate with our existing hardware? If not, what would need to change?
3. Real-Time vs. Batch
What's your latency requirement? Manufacturing QC needs sub-100ms decisions (conveyor moving). Medical imaging can tolerate seconds. Logistics needs real-time tracking.
Ask: What latencies have you achieved for similar systems? Where does processing happen (edge or cloud)?
4. Data Requirements & Labeling
Computer vision models need labeled training data. This is expensive and time-consuming.
Ask: How much labeled data will we need? How do we collect and label it? What's the timeline and cost?
Smart approach: Start with existing data (past 6 months of images). Label 500–1,000 examples. Train a model. Use model predictions to identify hard cases (images the model is uncertain about). Have humans label those. Iteratively expand dataset.
5. Model Interpretability
For high-stakes decisions (healthcare, hiring), explainability matters. Can you understand why the model made a decision?
Ask: Can we visualize which parts of the image the model is looking at? Can we explain decisions to stakeholders?
6. Monitoring & Maintenance
Models degrade over time as images shift. You need monitoring and retraining pipelines.
Ask: What happens after deployment? How do you monitor performance? How often do you retrain? Who's responsible if accuracy drops?
Real-World Implementation: 5 Steps
1. Define the Problem (1–2 weeks)
- What are we trying to solve? (Defect detection, damage assessment, object counting, etc.)
- What's the cost of failure? (Missed defects lead to recalls; misrouted packages cost €50 each)
- What's the volume? (100 items/day or 100,000 items/day? Volume determines approach)
- What's the latency requirement? (Sub-100ms or can we batch daily?)
2. Data Collection & Exploration (2–4 weeks)
- Collect representative images from your environment (different lighting, angles, product variations)
- Explore: How much variation exists? Are there edge cases?
- Assess: Is this problem solvable with CV? (If objects are too similar or images are too degraded, CV may not work)
3. Model Development & Training (4–8 weeks)
- Collect and label training data (1,000–10,000 labeled examples depending on complexity)
- Train candidate models (pre-trained ResNet, YOLO, Mask R-CNN, etc.)
- Evaluate on hold-out test set
- Iterate: collect harder examples, improve model
4. Deployment & Integration (2–4 weeks)
- Package model for production (Docker, ONNX, TensorFlow Serving)
- Integrate with your systems (API calls, real-time streaming, batch processing)
- Deploy to target hardware (cloud API, edge device, hybrid)
- Load test: Can it handle peak volume? What's latency at scale?
5. Monitoring & Optimization (Ongoing)
- Dashboard: accuracy, latency, volume, errors, edge cases
- Alert: If accuracy drops below threshold or latency exceeds target
- Feedback loop: Collect real-world predictions, label errors, retrain monthly
- Budget: 10–15% of initial development cost ongoing for maintenance and optimization
Computer Vision Services Pricing
Small pilot project (proof of concept):
- Dataset labeling: €5k–15k
- Model development: €20k–40k
- Deployment: €5k–10k
- Total: €30k–65k
- Timeline: 8–12 weeks
Production system (manufacturing QC, medical imaging):
- Dataset labeling: €30k–100k
- Model development: €100k–200k
- Hardware/integration: €50k–300k
- Deployment & monitoring: €20k–50k
- Total: €200k–650k
- Timeline: 16–24 weeks
Managed services (ongoing):
- Monitoring and maintenance: €3k–10k/month
- Periodic retraining: €10k–30k per cycle (quarterly)
- Incident response: Included or premium support
When to hire a partner: If you lack in-house CV expertise or need to accelerate. A partner can deliver in 4–6 months what might take your team 12+ months.
Challenges & Limitations of Computer Vision
1. Lighting and environmental variation:
- Model trained on well-lit manufacturing floor fails when lighting changes
- Solution: Data augmentation, controlled lighting, multiple lighting angles
2. Image quality degradation:
- Dusty sensors, worn lenses, poor focus
- Solution: Regular camera maintenance, edge filtering, sensor cleaning alerts
3. Class imbalance:
- Defects are rare (0.1% of parts are defective). Model learns to predict everything as "good"
- Solution: Resampling, cost-weighted loss, careful metric selection (recall vs. precision)
4. Novel objects or scenarios:
- Model trained on 2024 product line encounters 2025 variant with subtle design change
- Solution: Continuous monitoring, retraining on new variants, human-in-the-loop for uncertain cases
5. Interpretability:
- "Why did the model reject this part?" Hard to explain
- Solution: Use techniques like Grad-CAM to visualize which image regions influenced the decision
6. Privacy concerns:
- Deploying cameras in sensitive areas (healthcare, personal spaces)
- Solution: Local processing (edge inference), anonymization, clear privacy policies
FAQ: Computer Vision Services
Q: How much labeled training data do we need? A: Minimum 500–1,000 labeled examples. Ideal is 5,000–10,000 for robust models. More is better. For rare events (defects that occur 0.1% of the time), you need more examples of the rare class.
Q: Can we use synthetic data? A: Yes, increasingly. Synthetic images generated from 3D models can supplement real data. Reduces labeling cost by 30–50%. But combine with real data for robustness.
Q: What's the accuracy we should expect? A: Depends on task. Simple classification (is this part good or bad): 98–99%. Object detection (where are the defects): 90–95%. Medical diagnosis: 95–98% (but tested on clinical validation set). Always compare to human baseline.
Q: How often does the model need retraining? A: Monthly or quarterly as new data arrives. If accuracy degrades, retrain immediately. Build automated retraining pipelines so it's not manual.
Q: Can we use existing models (YOLO, ResNet) or do we need custom? A: Start with existing models (transfer learning). Fine-tune on your data. Custom models are rarely necessary unless you have a truly novel problem and massive data (10M+ images).
Q: What if we don't have labeled training data yet? A: Start collecting now. It's the biggest blocker. You won't deploy for 3–6 months while data is being labeled, but that's the reality. Use that time to plan other aspects of the system.
Q: Can we use phone cameras or do we need industrial cameras? A: Industrial cameras for consistent, high-quality results. Phone cameras work for prototyping but have variable autofocus, exposure, white balance. Industrial cameras have manual control and higher reliability.
Conclusion: Computer Vision Is Mature, Proven, and Accessible
Computer vision services have moved from research labs to production systems. Manufacturing plants, hospitals, retailers, and logistics companies are deploying computer vision today and capturing significant value: reduced labor, improved quality, faster decisions, better safety.
If you have a problem involving images or video—defect detection, damage assessment, quality control, medical imaging analysis, inventory management, safety monitoring—computer vision likely applies.
The barrier to entry has dropped. Pre-trained models are free. Cloud APIs are cheap. Tools for data labeling, model training, and monitoring are accessible. The main cost is data labeling and integration work.
AI consulting company specializing in computer vision can assess your use case, guide data collection, develop a production model, and train your team. Budget 4–6 months and €200k–400k for a production system. ROI is typically 12–18 months through labor reduction, quality improvement, or revenue increase.
Start with a small pilot. Prove the concept on a non-critical use case. Then scale to core operations.
Related Articles
- AI implementation — Strategic approach to deploying computer vision at your organization
- AI development company — Finding the right partner to build your vision system
- Predictive analytics — Using vision data to make predictive decisions (e.g., yield prediction)