

Predictive Analytics for Business: How ML Models Drive Better Decisions
Predictive analytics transforms how organizations make decisions. Instead of guessing what will happen next month based on intuition or yesterday's trends, you build ML models that learn from your data and forecast future outcomes with precision. The difference between reacting to problems and anticipating them is the difference between firefighting and strategy.
Predictive analytics isn't new in concept—insurance companies have used actuarial modeling for centuries. But modern machine learning makes it accessible to every business, at scale. A retailer can predict next quarter's demand for each product across each store. A bank can score credit risk for every applicant in seconds. A telecom can identify customers about to churn before they leave.
This guide walks you through predictive analytics for business: what it is, the different model types you'll encounter, real-world use cases by function, the data you need, and how to implement it without drowning in complexity.
What is Predictive Analytics? The Core Concept
Predictive analytics is the practice of using historical data and machine learning to forecast future events. It differs from descriptive analytics (what happened?) and diagnostic analytics (why did it happen?). It answers: What will happen next?
The simplest example: You have 5 years of monthly sales data for your e-commerce business. A predictive model learns the patterns—seasonality, growth trends, day-of-week effects—and predicts next month's revenue. As new data arrives each month, the model retrains and improves.
A more complex example: A manufacturing plant has sensor data from 100 machines—temperature, vibration, pressure—recorded every minute for 2 years. A predictive model learns what normal operation looks like and forecasts which machines will fail in the next 7 days. Maintenance teams can schedule repairs before catastrophic failures.
The core workflow is simple:
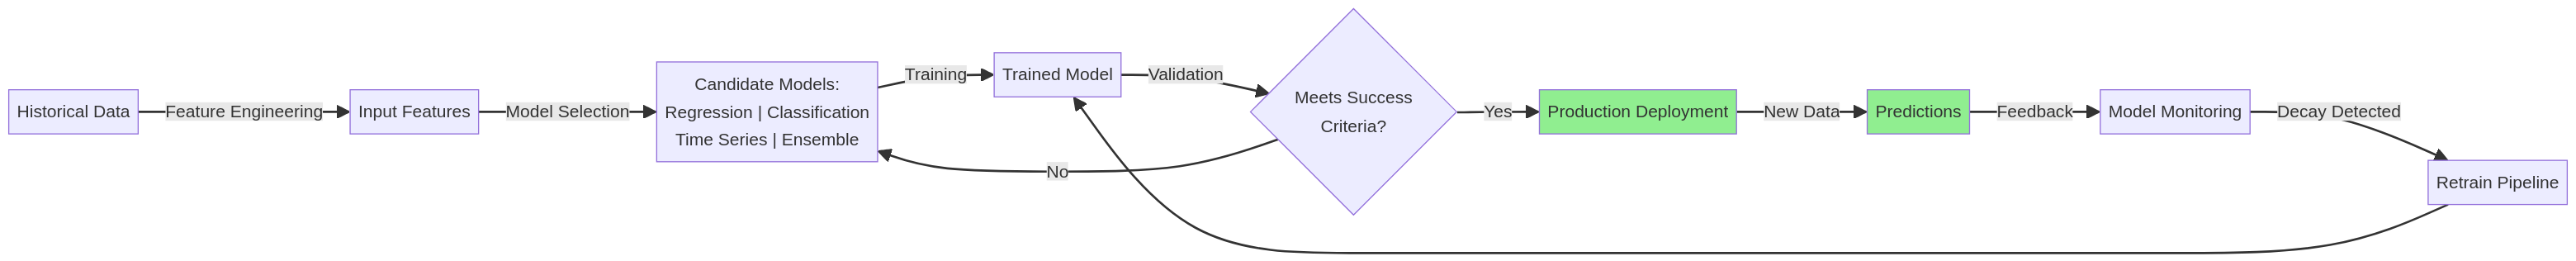
Key insight: The model is never "done." It lives in production, makes predictions, and is continuously monitored for accuracy decay. When new data reveals that patterns have shifted, the model retrains automatically.
Model Types: Know What You're Building
Different prediction problems require different model architectures. Here's what you'll encounter:
1. Regression: Predicting Continuous Values
What it does: Forecasts a continuous number—revenue, demand quantity, price, wait time.
Examples:
- Predicting next month's sales volume for a product (output: units sold)
- Estimating customer lifetime value (output: total revenue in dollars)
- Forecasting energy consumption for a facility (output: kilowatt-hours)
Common algorithms:
- Linear Regression (simple, interpretable, fast)
- Polynomial Regression (captures non-linear relationships)
- Ridge / Lasso Regression (prevents overfitting on high-dimensional data)
- Support Vector Regression / XGBoost (more complex, handles non-linearities better)
Evaluation metrics: Mean Absolute Error (MAE), Root Mean Squared Error (RMSE), R² score
Pros: Interpretable, fast to train, works with modest data volumes Cons: Assumes relationships are relatively smooth; struggles with sudden breaks or discontinuities
2. Classification: Predicting Categories
What it does: Assigns an observation to a category—will churn or not, will default or not, is fraud or not.
Examples:
- Churn prediction: Predict which customers will cancel next month (binary: churn or stay)
- Credit risk: Classify applicants as low/medium/high risk (multi-class)
- Fraud detection: Identify fraudulent transactions (binary: fraud or legitimate)
- Lead scoring: Classify sales leads as hot/warm/cold (multi-class)
Common algorithms:
- Logistic Regression (simple, interpretable, probabilistic)
- Decision Trees / Random Forests (handle non-linearity, feature interactions)
- Gradient Boosting (XGBoost, LightGBM) (state-of-the-art for structured data)
- Neural Networks (best for unstructured data, but harder to interpret)
Evaluation metrics: Precision, Recall, F1-Score, AUC-ROC (for binary), Confusion Matrix
Key concept: Class Imbalance. If you're predicting something rare (fraud is 0.1% of transactions), a naive model that predicts "legitimate" every time is 99.9% accurate but useless. You need specialized techniques: resampling, cost-weighted loss, threshold adjustment.
Pros: Directly actionable (act on flagged cases), works well with many algorithms Cons: Class imbalance complicates evaluation; requires careful metric selection
3. Time-Series Forecasting: Predicting Sequential Data
What it does: Forecasts future values in a time-ordered sequence—daily sales, hourly traffic, quarterly revenue.
Examples:
- Demand forecasting (how many units will we sell next week?)
- Stock price prediction (will the price go up or down?)
- Website traffic forecasting (how many visitors tomorrow?)
- Energy load forecasting (electricity demand for the grid)
Why it's different: Time-series data has temporal dependencies (tomorrow's value depends on today's), seasonality (patterns repeat weekly/monthly/yearly), and trends. Standard regression assumes observations are independent—which they're not.
Common algorithms:
- ARIMA (AutoRegressive Integrated Moving Average) — classical, interpretable, good for stationary series
- Prophet (Facebook's open-source tool) — handles seasonality and holidays well, great for business applications
- Exponential Smoothing (Holt-Winters) — weights recent data more heavily
- LSTM / GRU (deep learning) — captures long-range dependencies, best for complex patterns
- Ensemble methods (combine multiple forecasts) — usually more accurate than any single model
Evaluation metrics: Mean Absolute Percentage Error (MAPE), Mean Absolute Error (MAE), Root Mean Squared Error (RMSE)
Key concept: Train-test split. Time-series evaluation must respect temporal order. You train on past data and test on a future hold-out period. You never test on historical data and train on future data (that's data leakage).
Pros: Specialized techniques handle seasonality and trends; many algorithms available Cons: Requires more data (typically 2+ years), sensitive to structural breaks, difficult to interpret why
4. Ensemble Methods: Combining Multiple Models
What it does: Trains multiple models and combines their predictions—usually more accurate than any single model.
Examples:
- Random Forest (ensemble of decision trees)
- Gradient Boosting (XGBoost, LightGBM, CatBoost) (sequential ensemble that corrects previous errors)
- Voting / Stacking (combine outputs from multiple models)
Why ensembles work: Different models make different types of errors. By combining them, you reduce variance and often improve accuracy by 5–15%.
Trade-off: More complex, slower to train, harder to interpret. But usually worth the complexity.
Pros: Often achieve state-of-the-art accuracy; work with high-dimensional, mixed-type data Cons: Computationally expensive, less interpretable ("black box")
Real-World Use Cases: Where Predictive Analytics Delivers Value
Sales & Revenue
Demand Forecasting:
- Historical sales data → ML model → Next month's unit sales by product/region
- Value: Inventory optimization (avoid stockouts and overstock), procurement planning, revenue forecasting
- Use case: Retail chain with 200 SKUs across 50 stores. Model improved forecast accuracy from MAPE 18% to 8%, reducing excess inventory by €2.1M annually
Lead Scoring:
- Lead data (industry, company size, engagement, website behavior) → ML model → Likelihood to purchase
- Value: Sales team focuses on highest-probability leads, shortens sales cycle
- Use case: B2B SaaS company. Model identified that leads with 5+ product interactions were 6x more likely to convert. Sales prioritized those leads and increased monthly conversions by 23%
Customer Lifetime Value (CLV):
- Historical customer data → ML model → Predicted total revenue a customer will generate
- Value: Identify high-value customers for retention investment, optimize customer acquisition budgets
- Use case: E-commerce business. Model predicted CLV with 89% accuracy. Marketing reallocated spend to segments with 3-year CLV > €500, improving return on ad spend by 34%
Operations & Efficiency
Predictive Maintenance:
- Sensor data (temperature, vibration, pressure) + maintenance history → ML model → Failure risk in next 7/30 days
- Value: Schedule maintenance before failures; reduce unplanned downtime; extend equipment life
- Use case: Manufacturing plant with 80 machines. Predictive maintenance model reduced unplanned downtime by 47% and maintenance costs by 19%
Capacity Planning:
- Historical traffic/demand data → ML model → Future resource requirements
- Value: Optimize workforce scheduling, infrastructure provisioning, cost control
- Use case: Data center. Model forecasts CPU, memory, and bandwidth demand hourly. Infrastructure team provisions capacity 2 weeks ahead, reducing over-provisioning by 31% and improving SLA compliance
Process Optimization:
- Process execution data → ML model → Cycle time, quality, defect rate
- Value: Identify bottlenecks, optimize workflows, reduce waste
- Use case: Logistics company. Model identified that shipments routed through Distribution Center A had 8% longer processing times. Process changes reduced processing time by 22%
Finance & Risk
Credit Risk / Default Prediction:
- Applicant data (income, credit history, assets, liabilities) → ML model → Default probability
- Value: Approve good-risk loans faster, reject bad-risk loans, optimize loss rates
- Use case: Bank receives 500 loan applications daily. ML model scores each in 2 seconds, reduces approval time from 5 days to 24 hours, improves loan portfolio risk-adjusted returns by 12%
Fraud Detection:
- Transaction data (amount, merchant, location, time, purchase history) → ML model → Fraud probability
- Value: Block fraudulent transactions real-time, reduce chargebacks and losses
- Use case: Fintech company. Model flags 0.3% of transactions as high-risk fraud. Manual review confirms 78% are actual fraud. System blocks €1.8M in monthly fraud losses; false-positive rate (legitimate transactions blocked) is 0.02%
Portfolio Risk:
- Historical prices, correlations, volatility → ML model → Expected return and risk of portfolio
- Value: Optimize asset allocation, hedge risk, stress-test scenarios
- Use case: Asset manager. Predictive model backtested on 10 years of data recommends daily portfolio rebalancing. Strategy outperforms buy-and-hold by 2.3% annually with lower drawdown
Marketing & Customer Experience
Churn Prediction:
- Customer behavior data (engagement, support tickets, usage decline) → ML model → Churn probability
- Value: Identify at-risk customers; trigger retention campaigns; reduce customer loss
- Use case: SaaS company with 10,000 customers. Churn model identifies 3% of customers at high risk of not renewing. Targeted retention campaign (discount, dedicated support, feature unlock) converts 40% of flagged customers. Saves €450k in annual recurring revenue
Campaign Response:
- Customer segment + historical campaign data → ML model → Likelihood to respond
- Value: Personalize campaigns, improve response rates, increase ROI
- Use case: Retail bank. Model segments customers by likelihood to adopt new products. High-propensity segment shows 8% response rate vs. 2% untargeted. Campaign ROI improves by 320%
Next-Best Action:
- Customer history + contextual data → ML model → Best offer/action to maximize value
- Value: Personalization at scale, increase average customer value
- Use case: E-commerce platform. Real-time model recommends next product each customer should see. Personalized recommendations increase click-through by 18%, conversion by 12%
Data Requirements: What You Need to Start
Every predictive modeling project starts with the same question: Do we have enough good data?
Volume: How Much Data Do You Need?
Rule of thumb: Minimum 100-200 observations per class for classification; 500+ for robust models; 2+ years for time-series.
Why? ML models learn by finding patterns in historical data. Too little data, and the model overfits (memorizes training data and fails on new data). Too much, and training gets slow.
Practical guidance:
- Simple models (logistic regression): 50–100 observations minimum
- Complex models (deep learning): 10,000+ observations ideal
- Time-series: 24+ months minimum (to capture seasonal patterns), ideally 5+ years
- Rare events (fraud, churn): 1,000+ total observations with at least 50 positive cases
What if you don't have enough data?
- Use simpler models that don't overfit (logistic regression, decision trees)
- Engineer features that compress information from limited data
- Transfer learning (use a model pre-trained on similar data, fine-tune on yours)
- Start with a pilot / proof-of-concept; collect more data while initial model runs
Quality: Garbage In, Garbage Out
Raw data is messy. You need to clean it.
Common data quality issues:
- Missing values: Customers where revenue is null, sensors where readings are blank
- Outliers: A product with 1 million sales (likely a data entry error in a system where typical sales are 10–100)
- Inconsistent encoding: "NY", "New York", "NEW YORK" should be the same
- Duplicate records: Same customer entered twice with slight variations
- Temporal misalignment: Data from different time periods mixed together
- Class imbalance: 99% negative cases, 1% positive (fraud, churn, defaults)
Data quality work:
- Inspect distributions (are values where they should be?)
- Remove or impute missing values
- Standardize formats and encodings
- Deduplicate
- Handle outliers (remove, cap, or transform)
- Balance classes (resampling, cost-weighting, threshold adjustment)
Time investment: 60–70% of ML project time goes to data cleaning and feature engineering. This isn't exciting, but it's where projects succeed or fail.
Feature Relevance: Does Your Data Predict the Target?
The best ML algorithm can't predict outcomes that aren't in your data.
Example: You want to predict which customers will upgrade to premium. You have:
- User ID
- Account age
- Days since login
- Feature usage (count per week)
- Support tickets (count)
- Company size
- Industry
- Region
These features are useful. But if you don't have:
- Customer satisfaction scores
- Pricing sensitivity
- Competitor interactions
- Product roadmap (what features they want)
Your model will be weaker. It can only predict from what it sees.
Before building, ask:
- What data do we have that correlates with the outcome we're trying to predict?
- What data are we missing that would obviously help?
- Can we collect it? How long would it take?
Implementation Approach: From Data to Decisions
Phase 1: Discovery & Scoping (2-3 weeks)
Goal: Define the problem, assess feasibility, build business case.
Steps:
- Identify the prediction problem. What do we want to forecast? Who will act on predictions? What decisions would change?
- Assess data availability. What data do we have? How complete? How recent? Do we need to collect more?
- Define success metrics. Not just model accuracy—business metrics. If we deploy this model, what improves? Revenue? Cost? Risk? By how much?
- Estimate value. If the model achieves target accuracy, what's the financial impact? (E.g., reducing churn by 5% = €500k retained revenue)
- Set constraints. Timeline? Budget? Regulatory requirements (GDPR, financial regulations)? Data residency?
Output: 1-2 page project charter with problem statement, success criteria, constraints, and estimated value.
Phase 2: Data Preparation (2-4 weeks)
Goal: Transform raw data into features the model can use.
Steps:
- Data ingestion. Pull historical data from relevant systems (CRM, ERP, databases, data warehouse)
- Exploratory analysis. Visualize distributions, correlations, missing values. Understand the data.
- Cleaning. Remove duplicates, handle missing values, standardize formats, fix inconsistencies
- Feature engineering. Create new features from raw data
- Aggregate: Total spend in last 12 months
- Temporal: Days since last purchase, account age
- Ratios: Revenue per customer / Cost per acquisition
- Categorical encoding: Turn text (region, product category) into numbers
- Feature selection. Which features matter most? Drop low-signal features to reduce noise.
- Data splitting. Divide into training (70%), validation (15%), test (15%). For time-series: train on past, test on held-out future
Output: Clean dataset with engineered features, ready for modeling.
Phase 3: Model Development (3-6 weeks)
Goal: Train, evaluate, and select the best model.
Steps:
- Baseline model. Start simple. A baseline logistic regression model for churn prediction takes days; you immediately learn what's predictive.
- Candidate models. Train 3-5 different algorithms (e.g., logistic regression, random forest, gradient boosting, neural network). Run in parallel.
- Hyperparameter tuning. For each algorithm, find the best settings (learning rate, tree depth, regularization). Use grid search or Bayesian optimization.
- Cross-validation. Evaluate each model on multiple train/test splits to ensure stability.
- Performance evaluation. Compare models on metrics that matter:
- Classification: Precision, Recall, F1, AUC-ROC
- Regression: MAE, RMSE, R²
- Business metrics: For churn prediction, how many at-risk customers does the model identify? What's precision (% identified who actually churn)?
- Model selection. Choose the model that best balances accuracy, interpretability, and speed.
Output: Trained model with performance report. Example: "XGBoost model achieves 0.89 AUC on hold-out test set, identifies 76% of churners with 62% precision."
Phase 4: Deployment & Monitoring (2-4 weeks)
Goal: Get the model into production and running predictions.
Steps:
- Model packaging. Save the trained model in a portable format (ONNX, SavedModel, Pickle)
- API / Integration. Wrap the model in an API or integrate into your application
- Batch vs. real-time:
- Batch: Monthly demand forecast. Prediction runs once per month, results saved to database
- Real-time: Credit risk scoring. Prediction runs when application is submitted, result returned immediately
- Monitoring. Set up dashboards to track:
- Prediction volume (is the model being used?)
- Prediction latency (is it fast enough?)
- Model performance (is accuracy holding up?)
- Data quality (is input data healthy?)
- Retraining pipeline. Automate retraining weekly/monthly as new data arrives. Validate new model against test set before promotion.
- Feedback loop. Capture outcomes (did the churn prediction customer actually churn? did the forecast accuracy hold?). Use feedback to continuously improve.
Output: Production model serving predictions. Monitoring dashboards. Retraining pipeline.
Phase 5: Optimization & Continuous Improvement (Ongoing)
Goal: Improve accuracy and business impact over time.
Steps:
- Performance monitoring. Track model accuracy and business metrics over time. When does accuracy drift? Why?
- Root cause analysis. If model accuracy drops, diagnose: Is input data quality degrading? Have business patterns shifted?
- Feature refinement. Engineer new features based on learnings
- Model updates. Retrain with new data and improved features
- Business impact analysis. How much value is the model creating? Revenue saved? Costs reduced? Cost per prediction?
Expected timeline: Initial model, 2-3 months. Production optimization, 6-12 months to mature.
Building vs. Buying: DIY or Outsource?
Build in-house if:
- You have skilled ML engineers on staff
- The problem is core to your business (competitive advantage)
- You need ongoing iteration and customization
- You have sufficient data and infrastructure
Hire a company if:
- You lack ML expertise
- The project is one-off or lower priority
- You need speed (partner can deliver faster)
- You want someone to manage infrastructure and monitoring
Hybrid approach (most common):
- Partner builds initial model and trains your team
- Your team owns and operates the model long-term
- Partner provides retainer support for optimization
Common Pitfalls to Avoid
Solving the wrong problem. Building a churn prediction model when the real issue is product quality. Predict first, act second.
Data leakage. Using information in training that wouldn't be available at prediction time. E.g., predicting churn using the fact that the customer canceled (which you're trying to predict).
Ignoring class imbalance. A fraud detection model that's 99% accurate but misses 95% of fraud. Use stratified sampling, cost-weighted loss, threshold adjustment.
Not defining success metrics. Building the model with best possible accuracy, but it doesn't create business value. Link metrics to outcomes.
Poor data quality. Garbage in, garbage out. Spend time cleaning.
Overfitting. Model memorizes training data and fails on real data. Use cross-validation, regularization, early stopping.
No monitoring. Model deploys, nobody checks if it's working. Set up dashboards and alerts.
Lack of domain expertise. The data scientist doesn't understand your business. Pair them with domain experts.
FAQ: Predictive Analytics for Business
Q: How accurate does a predictive model need to be to be useful? A: Depends on the application. For churn prediction, 70–75% accuracy might be acceptable (you've identified the highest-risk cohort). For fraud detection, you might need 90%+ accuracy to avoid false positives. For mission-critical predictions (healthcare), 99%+ is necessary. Always compare to baseline (what's our current best guess?) and business value (what's the cost of a wrong prediction?).
Q: How long does it take to build a predictive model? A: 2–4 months for a typical business problem, including discovery, data prep, modeling, and deployment. Simpler problems (low-hanging fruit) can be done in 4–6 weeks. Complex problems (novel data sources, regulatory requirements) take 4–6 months. Timeline depends heavily on data availability and quality.
Q: How much does predictive analytics cost? A: Varies widely. A simple pilot project: €25k–50k. A full production system with 3–4 month development: €100k–250k. Ongoing managed services (model monitoring, retraining, optimization): €5k–15k/month. Cost scales with problem complexity, team size, and infrastructure requirements.
Q: What if we don't have historical data? A: Start collecting now. You won't have predictions for 6–12 months, but you're building the foundation. In the interim, use domain expertise and simpler heuristics. Once you have 2+ years of data, deploy the ML model and it will outperform heuristics.
Q: Can we predict without a data scientist? A: For simple problems (demand forecasting with Prophet, lead scoring with logistic regression), you can use low-code tools (Auto-ML, data science platforms). For complex problems, you need expertise. Consider hiring a consultant or partner to build the first model, then your team maintains it.
Q: How do we handle regulatory requirements (GDPR, financial regulations)? A: Data privacy (GDPR): Use only data you're entitled to process. Anonymize where possible. Document consent. Implement data retention policies. Model explainability: Some regulations require you to explain why a prediction was made (especially in finance, healthcare, HR). This favors interpretable models (logistic regression, decision trees) over black-box models (neural networks). Work with your legal/compliance team early. EU AI Act compliance is an emerging regulatory requirement for high-risk AI systems.
Q: What happens if our model makes a bad prediction? A: Document it. Investigate why (data quality issue? pattern changed?). Retrain with new data. Add guardrails (e.g., "if confidence < 60%, route to manual review"). Over time, models improve as they're exposed to more diverse data. Expect some failures; the goal is continuous improvement, not perfection.
Conclusion: Predictive Analytics Is Table Stakes
Predictive analytics has moved from nice-to-have to competitive necessity. Companies that forecast demand accurately stock products efficiently. Companies that score credit risk effectively approve good loans fast. Companies that identify churn early retain more customers.
The good news: Modern ML makes predictive analytics accessible. You don't need a PhD in statistics. You need clarity on the business problem, decent data, and the right partner or team.
Start with discovery: What do you want to predict? Why? What decisions would change? From there, the path is clear: collect and clean data, build candidate models, evaluate, deploy, monitor, improve.
AI implementation typically starts with a high-impact predictive analytics project. Choose a problem where prediction creates clear business value, execute well, and you'll build organizational momentum for broader AI adoption.
Related Articles
- AI development company — How to hire a partner to build your predictive models
- AI consulting — Strategic guidance on where to apply predictive analytics
- Machine learning pipeline — Infrastructure for models in production